Introduction
Gross Domestic Product (GDP) measures the market value for all products and services within a country's borders. GDP Growth Rate is the percentage increase in GDP from quarter to quarter. To avoid double counting, GDP includes only the final product value; intermediate goods like shoelaces in a shoe are not counted.
Identity: GDP = Consumption + Investment + Government Spending + (Exports – Imports)
Objectives
- Compare GDP growth between developed (USA, China, Kuwait, etc.) and developing nations (Nepal, Pakistan, Bangladesh, etc.).
- Quantify how financial/economic indicators correlate with GDP.
Algorithm Used — Linear Regression
- Supervised ML algorithm modeling a linear relationship between a dependent variable (GDP) and multiple indicators (imports, revenue, taxes, net exports, etc.).
- Chosen for interpretability and to estimate strength of each indicator’s association with GDP.
Methodology
- Data collection
- Cleaning
- Preprocessing
- Visualization
- Model training & testing (Linear Regression)
Data Source & Cleaning
World Bank datasets (1997–2021) across South Asia, North America, and MENA; ~32 countries. Indicators split by type (currency / percentage / number). NA values replaced with 0 per documented reasons in metadata rather than mean imputation across countries.
Visualization & Findings
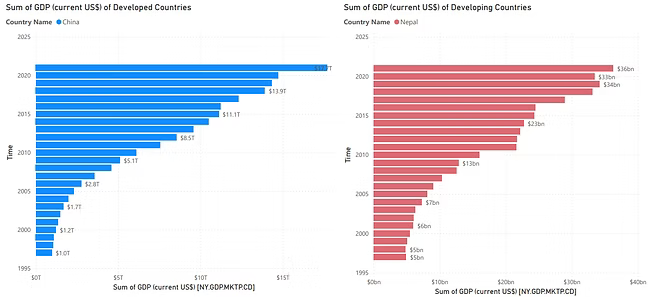
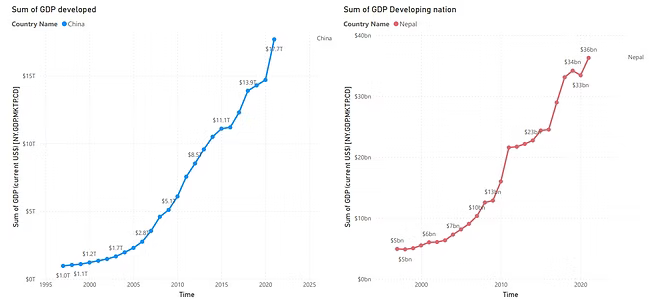
Nepal vs China — Total GDP Over Time
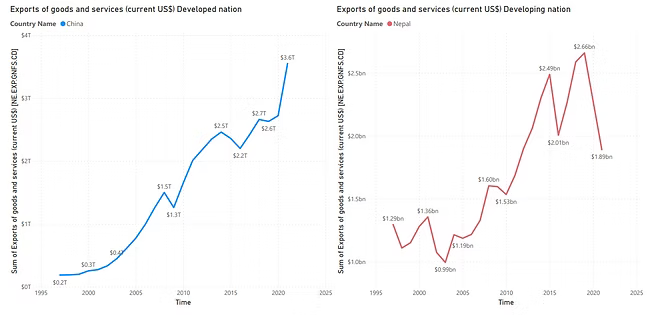
Exports of Goods & Services
GDP Per Capita Over Time

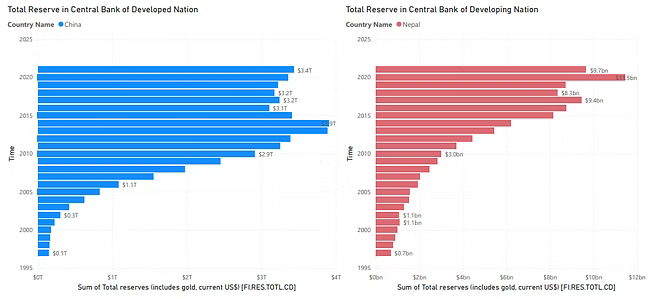
Total Reserves (incl. gold)
Gross National Income (GNI)

Predictive Modeling
Data split 70/30 (train/test). Linear regression on the currency indicators achieved an R² ≈ 0.99 for this dataset, suggesting a very strong linear fit.

Conclusion
GDP is strongly affected by trade and financial indicators and by country-specific shocks. Nepal shows sensitivity around the 2015 earthquake and the 2020 pandemic; export strength and reserve policies materially influence outcomes.
References
- World Bank indicators (Population, Reserves, etc.)
- Migration Data Portal (international migrant stocks)
- 2005 Nepal coup d’état — background context